Abstract
Objective
To evaluate whether, under rigorous internal validation, radiomic features extracted from a standardized patellar region on routine lateral knee radiographs can discriminate dual-energy X-ray absorptiometry (DXA)-defined bone mineral density categories, including osteoporosis.
Materials and Methods
This retrospective single-center study included 109 adult women (normal bone mineral density, n=22; osteopenia, n=66; osteoporosis, n=21). A fixed 15-mm patellar region of interest was analyzed using PyRadiomics 3.1.0, yielding 930 two-dimensional first-order and texture features. Fast correlation-based filter feature selection was performed exclusively within each training fold, with a maximum of 10 radiomic features retained in the principal analysis. Naive Bayes models were evaluated using 20 repetitions of stratified 10-fold cross-validation. Ninety-five percent confidence intervals (CIs) were estimated by patient-level bootstrap resampling.
Results
In the primary three-class analysis, the radiomics-only model yielded an osteoporosis-class area under the curve (AUC) of 0.660 (95% CI: 0.532-0.773), while the full clinical+radiomics model yielded an AUC of 0.668 (95% CI: 0.543-0.784). The full model achieved 49.5% overall accuracy and 41.8% balanced accuracy, whereas a majority-class classifier achieved 60.6% overall accuracy but only 33.3% balanced accuracy. In the secondary osteoporosis-versus-non-osteoporosis analysis, radiomics alone and the full clinical+radiomics model each yielded an AUC of 0.653 (95% CIs: 0.526-0.774 and 0.525-0.773, respectively). The addition of the clinical variables provided no incremental discrimination (Delta AUC: 0.000; 95% CI: -0.050 to 0.048).
Conclusion
Patellar radiomics showed modest discrimination of DXA-defined osteoporosis under leakage-free repeated internal validation. Clinical variables did not improve binary discrimination, and three-class performance remained limited. These findings should be considered exploratory and require external validation before clinical application.
Keywords: Osteoporosis, radiomics, patella, machine learning, bone mineral density
Introduction
Osteoporosis is a systemic skeletal disease characterized by low bone mass and microarchitectural deterioration that increases fracture risk, and it remains substantially underdiagnosed and undertreated worldwide (, ). Estrogen withdrawal after menopause accelerates osteoclastic bone resorption and trabecular deterioration (), while age-related bone loss further increases skeletal fragility ().
Dual-energy X-ray absorptiometry (DXA) is the reference standard for measuring bone mineral density (BMD) and operationally defines osteoporosis as a T-score of -2.5 or lower, with osteopenia between -1.0 and -2.5 (). Current screening recommendations target women aged 65 years or older and younger postmenopausal women at increased fracture risk, generally identified using clinical risk assessment (, ). Nevertheless, limited DXA access and underutilization leave many at-risk patients unscreened. This gap has motivated opportunistic screening, in which BMD-related information is extracted from imaging examinations obtained for other clinical indications without additional radiation exposure; opportunistic computed tomography (CT) screening may also be cost-effective ().
Radiomics converts medical images into quantitative descriptors of intensity and texture that can be linked to biological characteristics through machine learning (). Reproducibility across software, acquisition settings, and preprocessing remains a recognized challenge, and standardization initiatives have therefore become central to radiomics research (). The approach conceptually parallels trabecular bone score, a gray-level textural index derived from lumbar DXA that reflects trabecular microarchitecture (). Opportunistic BMD assessment has been demonstrated using deep learning on routine CT (), proximal-femur CT radiomics (), lumbar magnetic resonance apparent diffusion coefficient maps (), clival CT radiomics (), and volumetric Hounsfield unit analysis ().
Plain radiographs are more widely available than CT or magnetic resonance imaging. A small exploratory study reported an association between patellar radiographic texture and lumbar BMD (), and recent work indicates that knee () and foot or ankle radiographs () can support opportunistic osteoporosis screening. However, most radiograph-based studies have relied on deep-learning models with limited interpretability, and the contribution of simple clinical variables to a transparent patellar radiomics model has not been systematically examined.
We therefore evaluated whether patellar radiomic features from routine lateral knee radiographs, alone and in combination with age, body mass index (BMI), and estrogen-free years, could discriminate DXA-defined normal BMD, osteopenia, and osteoporosis using an interpretable Naive Bayes classifier. A secondary exploratory analysis evaluated the binary classification of osteoporosis versus non-osteoporosis.
Materials and Methods
Study Design and Patient Selection
This retrospective, single-center study was conducted in accordance with the Declaration of Helsinki. The institutional picture archiving and communication system and the hospital information system were searched to identify patients who had both a lateral knee radiograph and a DXA examination performed within 6 months of each other. A total of 146 potentially eligible patients were identified.
Thirty-seven patients were excluded: 14 were male; seven were younger than 18 years; eight had an implant, prosthesis, or a history of major fracture in the evaluated region; five had missing or incomplete radiographic or DXA data; two had inadequate image quality or anatomy unsuitable for standardized region-of-interest (ROI) placement; and one had advanced osteoarthritis. The final study cohort comprised 109 adult women ().
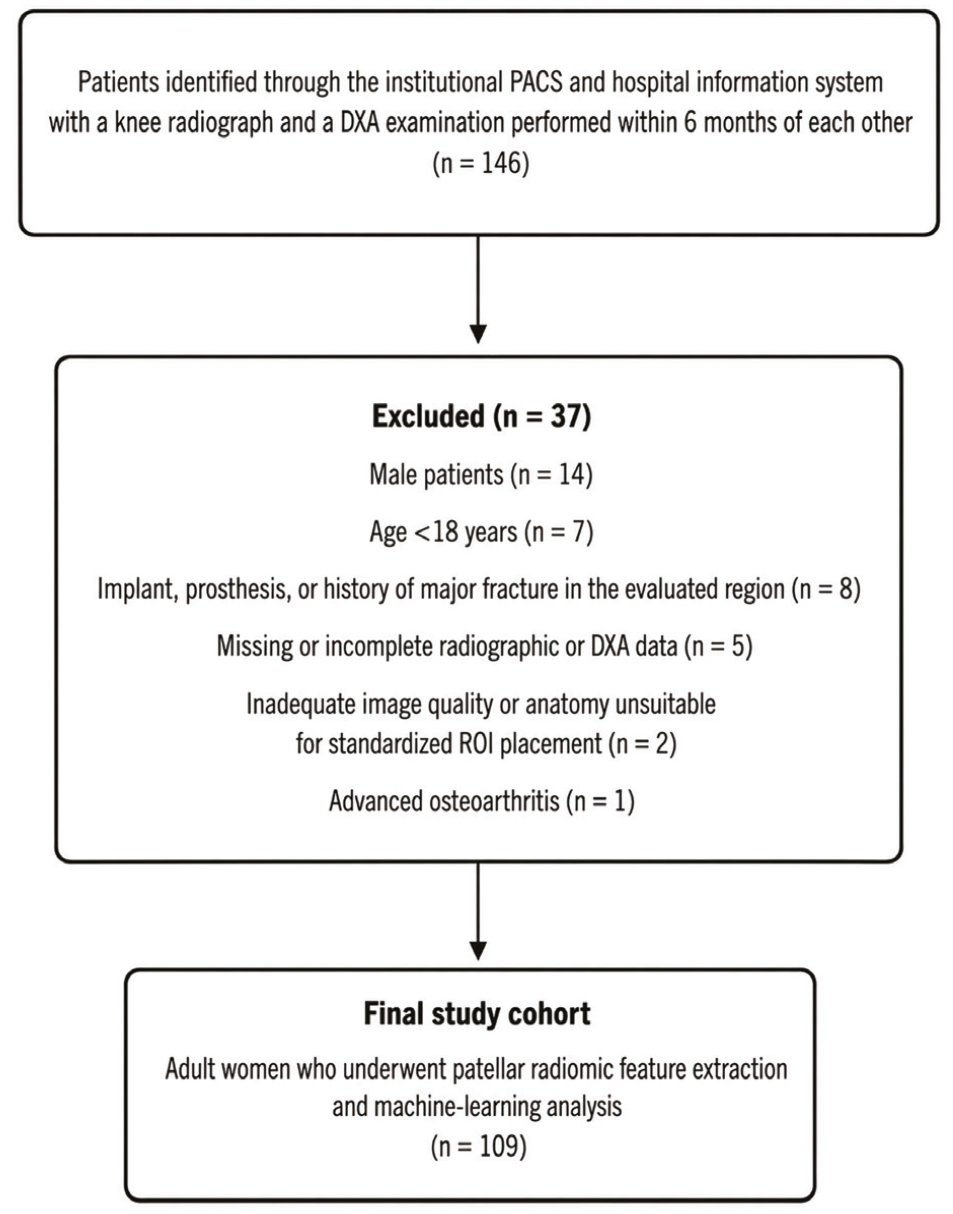
DXA: Dual-energy X-ray absorptiometry, PACS: Picture archiving and communication system, ROI: Region of interest
Age, BMI, and estrogen-free years were retrieved from the hospital information system. Estrogen-free years were defined as the number of completed years since menopause. A value of 0 was assigned to women who were premenopausal or who had entered menopause less than 1 year previously; these two states could not be reliably distinguished retrospectively. Five participants had a value of 0 (normal BMD, n=2; osteopenia, n=3; osteoporosis, n=0). When menopausal age could not be determined from the medical records, the variable was treated as missing. DXA reports were reviewed, and the lowest T-score documented across skeletal sites assessed during the clinical examination was used as the reference standard. Participants were grouped as normal (T-score>-1.0), Participants were grouped as normal (T-score ≥ -1.0), osteopenia (-2.5 < T-score < -1.0), or osteoporosis (T-score ≤ -2.5) (). The analytic dataset available for this retrospective study did not consistently retain data on the DXA scanner model, site-level quality-control records, or vertebra-level adjudication of degenerative/invalid lumbar measurements; the study, therefore, relied on the finalized clinical DXA report rather than on retrospective re-analysis of the raw DXA examination, and this limitation is acknowledged below.
Image Acquisition and Standardized ROI Placement
Lateral knee radiographs were obtained as part of routine clinical care, exported in DICOM format, and imported into 3D Slicer version 5.10.0 (www.slicer.org) (). A custom Python script configured the Segment Editor paint tool with a fixed absolute diameter of 15 mm and set the segmentation reference geometry based on the source image. A musculoskeletal radiologist with 10 years of experience divided the patella into three equal craniocaudal thirds and placed the circular ROI using a single click at the junction between the middle and lower thirds (). The predefined location was selected to predominantly sample trabecular bone while avoiding cortical margins, articular osteophytes, and the patellar tendon insertion. When more than one eligible lateral radiograph was available, the examination closest to the DXA date was selected. Because this was a retrospective routine-practice dataset, a single standardized exposure protocol could not be prospectively imposed; the per-examination radiographic system and exposure details were not consistently retained in the analytic dataset used for this study.
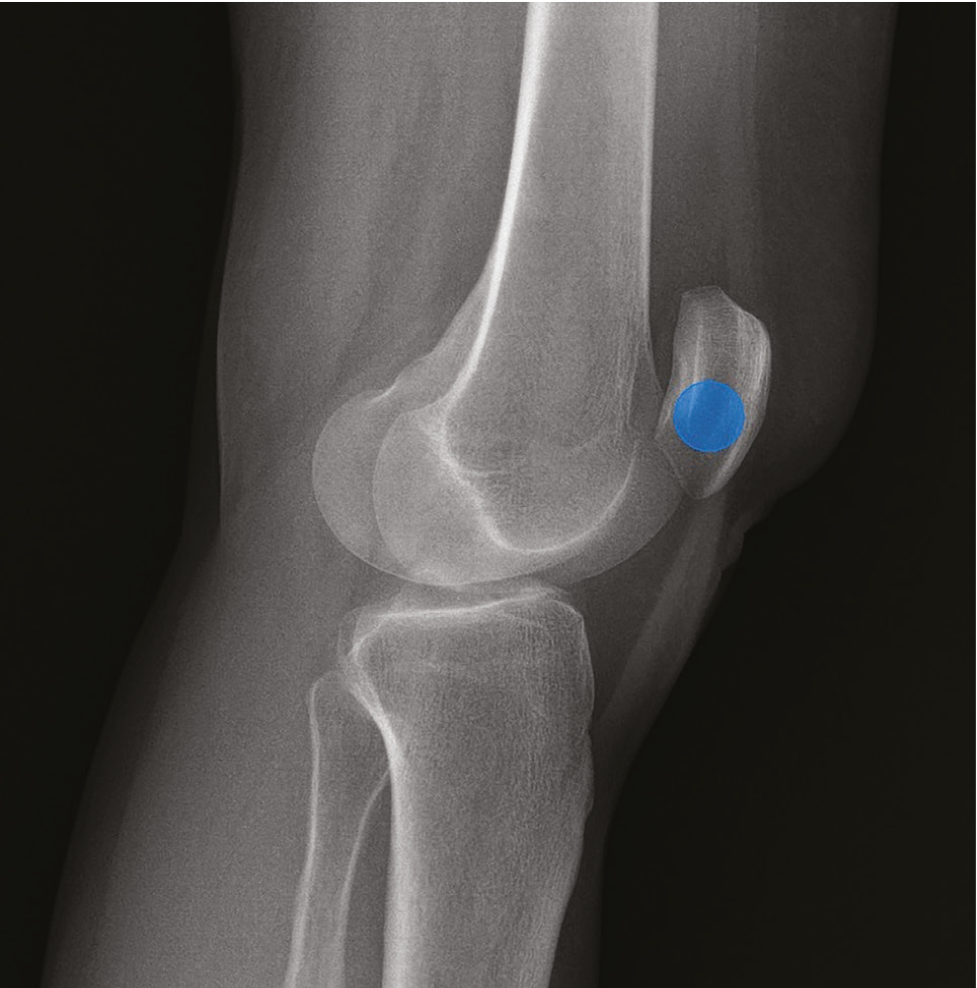
ROI: Region of interest
Radiomic Feature Extraction and Selection
Quantitative feature extraction was performed using PyRadiomics version 3.1.0 (). Single-slice NRRD images and their corresponding masks were explicitly converted to two-dimensional SimpleITK image objects before extraction. Whole-image pixel intensities were normalized using the PyRadiomics Z-score normalization procedure (normalize=True; default normalizeScale=1), and gray levels within each ROI were discretized using a fixed bin count of 64. No spatial resampling was applied; the original DICOM in-plane pixel spacing was retained. Accordingly, texture features remained potentially sensitive to differences in detector sampling and acquisition, which was considered in the interpretation of the results.
Because the same geometrically fixed 15-mm circular ROI was used for every participant, shape features were disabled. Exactly 930 features were extracted per ROI. These comprised 18 first-order features and 75 texture features: 24 gray-level co-occurrence matrix features, 16 gray-level run-length matrix features, 16 gray-level size-zone matrix features, 14 gray-level dependence matrix (GLDM) features, and five neighboring gray-tone difference matrix features. The 93 features were calculated from the original image, four level-one, two-dimensional Coiflet-1 wavelet decompositions (LL, LH, HL, and HH), and five Laplacian-of-Gaussian-filtered images with sigma values of 0.5, 1.0, 1.5, 2.0, and 3.0 mm. Diagnostic metadata generated by PyRadiomics were excluded. The string “3D” retained in LoG-derived output names reflects the fixed PyRadiomics nomenclature and does not indicate a three-dimensional texture calculation in this workflow.
Dimensionality reduction was performed using the fast correlation-based filter (FCBF), which prioritizes features associated with the outcome while reducing redundancy (). After re-examination of the archived analysis workflow, the entire modeling analysis was repeated using a strictly fold-contained feature selection procedure. FCBF was therefore fitted exclusively on each training fold and re-fitted independently in every fold and repetition. To reduce model complexity, given the limited number of osteoporosis cases, the principal revised analysis prespecified a maximum of 10 radiomic features. Sensitivity analyses used maximum feature counts of 5, 20, and 30. Continuous variables used for FCBF scoring were discretized by equal-frequency binning, consistent with the original Orange workflow. Clinical variables were not subjected to radiomic feature selection and were appended to the selected radiomic feature set when applicable.
Machine Learning and Statistical Analysis
A Naive Bayes classifier was retained to preserve the original modeling framework and its transparent probabilistic structure. The primary analysis was a three-class classification problem. Five feature sets were evaluated: () clinical-only (age, BMI, and estrogen-free years), () radiomics-only, () BMI+radiomics, () age+BMI+radiomics, and () full clinical+radiomics (age, BMI, estrogen-free years, and radiomics). A secondary exploratory binary analysis combined the normal and osteopenia groups into a non-osteoporosis class and compared clinical-only, radiomics-only, and combined clinical-radiomics models.
Internal validation was conducted using 20 repetitions of patient-level stratified 10-fold cross-validation with different fold assignments. For every training/held-out split, all data-dependent operations were confined to the training fold: FCBF feature selection was re-fitted, missing clinical values were imputed using training-fold means, standardization parameters were estimated from the training data, and the Naive Bayes model was fitted only after these steps. The fitted transformations and selected features were then applied unchanged to the corresponding held-out fold. Thus, no held-out observation contributed to imputation, scaling, feature selection, or model fitting ().
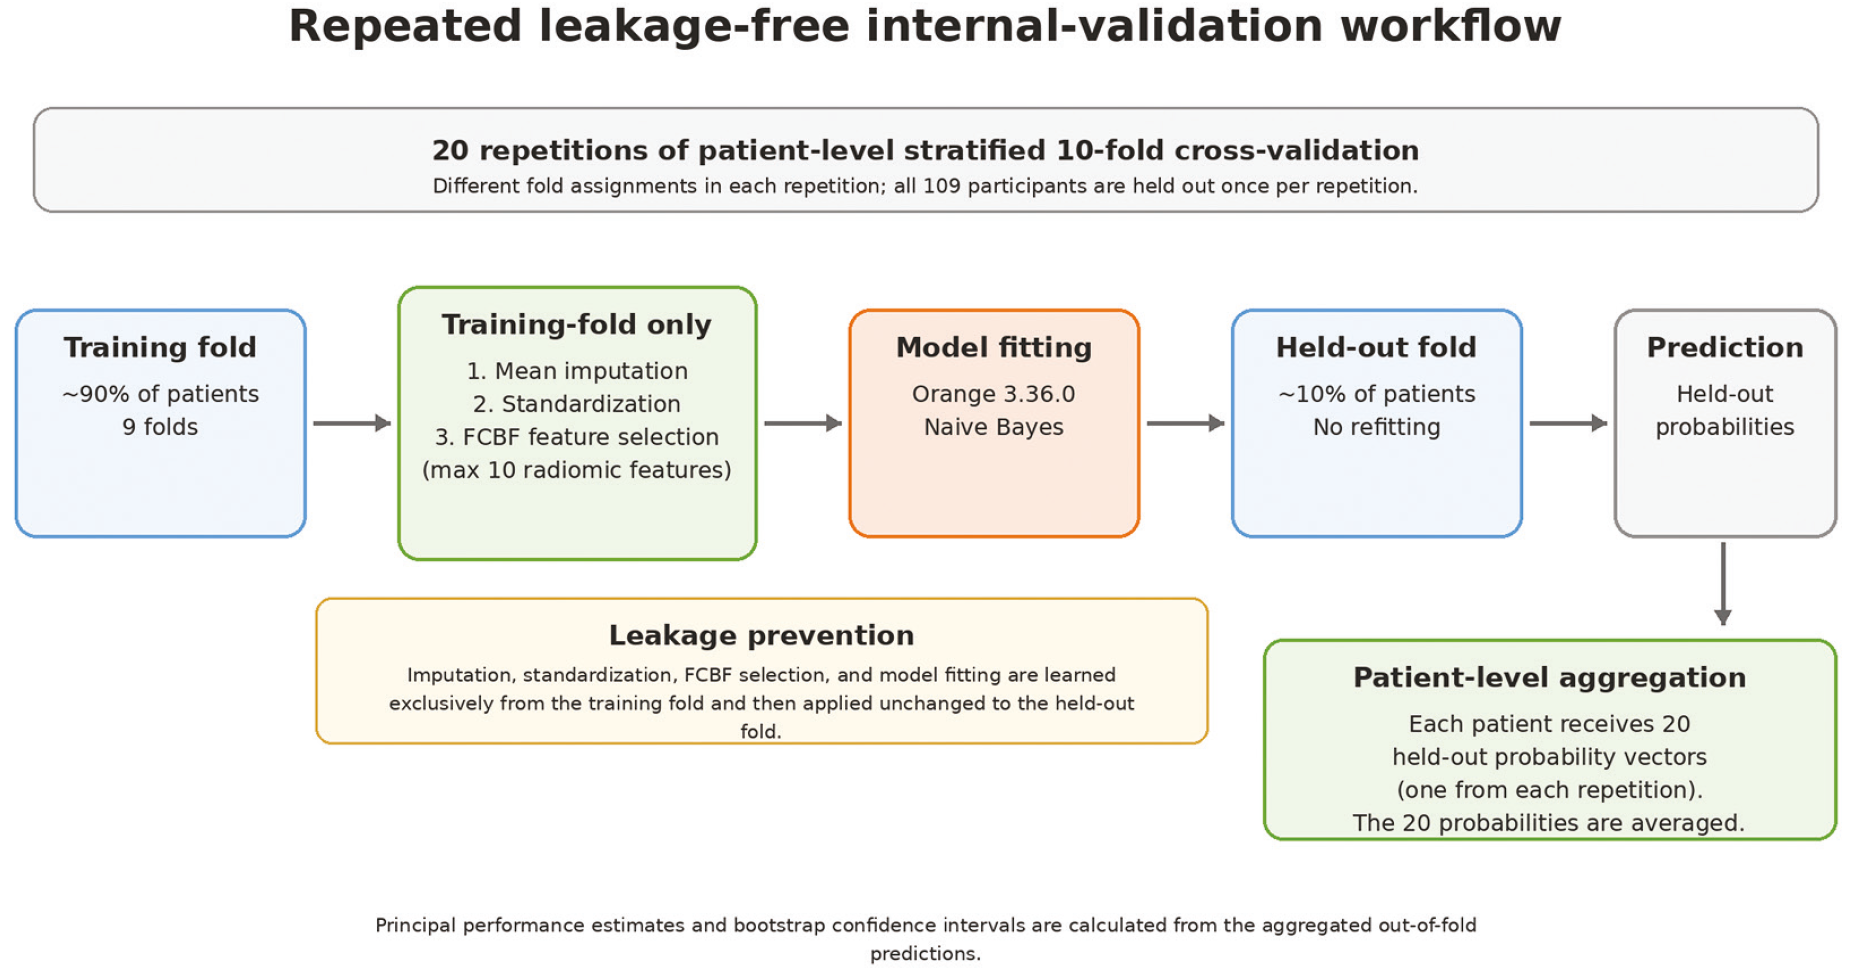
FCBF: Fast correlation-based filter
Each participant generated one held-out predicted probability for each of the 20 repetitions. For the principal patient-level evaluation, the 20 held-out probabilities for each participant were averaged to obtain one aggregated out-of-fold prediction. Class labels were assigned to the class with the highest posterior probability; for binary classification, this corresponds to a posterior probability threshold of 0.5. In the three-class analysis, osteoporosis discrimination was summarized in a one-versus-rest framework. Overall multiclass performance was evaluated using accuracy, balanced accuracy, macro-F1 score, and linearly weighted Cohen’s kappa. A majority-class benchmark, assigning every participant to osteopenia, was calculated explicitly.
For the secondary binary analysis, area under the curve (AUC), accuracy, sensitivity, specificity, precision, F1 score, and Matthews correlation coefficient were calculated. Ninety-five percent CIs for the principal AUC, sensitivity, and specificity estimates were obtained using 5,000 patient-level bootstrap resamples of the aggregated out-of-fold predictions. The difference in AUC between the full clinical+radiomics and radiomics-only models was evaluated by paired patient-level bootstrap resampling, using the same resampled participants for both models. To provide a conservative sensitivity analysis addressing ambiguity in menopausal status, all five participants whose estrogen-free years were coded as 0 were excluded, and the binary analysis was repeated (n=104). The revised analysis was executed in Python 3.10, using Orange Data Mining version 3.36.0 to run the official FCBF implementation and NaiveBayesLearner. Custom code orchestrated repeated stratified cross-validation, training-fold imputation and standardization, out-of-fold probability aggregation, bootstrap confidence intervals, and performance summaries. The pinned numerical environment included NumPy 1.23.5, SciPy 1.10.1, scikit-learn 1.1.3, and pandas 1.5.3.
Results
Study Population
Of the 109 women included, 22 (20.2%) had normal BMD, 66 (60.6%) had osteopenia, and 21 (19.3%) had osteoporosis. Mean age was 65.7±10.4 years and mean BMI was 29.8±5.5 kg/m2. Estrogen-free years were available for 98 participants and missing for 11 participants (10.1%). Baseline characteristics are summarized in .
Table 1. Baseline characteristics of the study cohort
Characteristic | Overall (n=109) | Normal (n=22) | Osteopenia (n=66) | Osteoporosis (n=21) |
Age, years | 65.7±10.4 | 61.8±11.0 | 65.8±10.0 | 69.4±9.9 |
BMI, kg/m2 | 29.8±5.5 | 31.8±5.1 | 28.8±5.4 | 30.8±6.1 |
Estrogen-free years | 20.0±9.9 (n=98) | 16.1±10.3 (n=21) | 20.1±9.8 (n=57) | 24.0±8.8 (n=20) |
Data are mean ± standard deviation. BMI: Body mass index. A value of 0 estrogen-free years represented either premenopausal status or less than 1 year since menopause; 11 values were missing
Radiomic Feature Selection and Stability
Exactly 930 radiomic features were extracted from each standardized patellar ROI. In the revised analysis, FCBF feature selection was repeated independently within each training fold, with a maximum of 10 radiomic features retained for the principal models. Across the 200 training folds generated by 20 repetitions of 10-fold cross-validation, feature selection showed substantial variability. In the three-class analysis, 220 different radiomic features were selected at least once; the most frequent feature, log-sigma-0-5-mm-3D_gldm_DependenceEntropy, was selected in 129/200 folds (64.5%). In the binary analysis, 191 different features were selected at least once; the most frequent feature, log-sigma-0-5-mm-3D_glszm_ZoneVariance, was selected in 180/200 folds (90.0%). No feature was selected in every training fold in either analysis, arguing against a single stable radiomic signature in this cohort.
Sensitivity analyses using feature caps of 5, 20, and 30 showed that increasing the number of retained features did not result in a monotonic improvement in discrimination (). In the binary radiomics-only analysis, the AUCs were 0.598, 0.653, 0.657, and 0.616 with maximum feature counts of 5, 10, 20, and 30, respectively. In the primary three-class analysis, the osteoporosis-class AUCs for the corresponding radiomics-only models were 0.625, 0.660, 0.661, and 0.655.
Table 2. Sensitivity of model performance to the maximum number of radiomic features retained
Maximum radiomic features | Three-class radiomics-only: osteoporosis AUC | Three-class radiomics-only overall accuracy | Three-class radiomics-only balanced accuracy | Binary radiomics-only AUC | Binary full clinical+radiomics AUC |
5 | 0.625 | 45.9% | 29.4% | 0.598 | 0.634 |
10 (principal) | 0.660 | 43.1% | 34.1% | 0.653 | 0.653 |
20 | 0.661 | 43.1% | 45.7% | 0.657 | 0.660 |
30 | 0.655 | 41.3% | 43.6% | 0.616 | 0.616 |
The full clinical+radiomics model included age, BMI, estrogen-free years, and radiomic features selected within each training fold. AUC: Area under the receiver operating characteristic curve, BMI: Body mass index
Primary Three-class Analysis
In the primary three-class analysis, discrimination for the osteoporosis class was modest across all internally validated models (). The clinical-only model yielded an osteoporosis-class AUC of 0.570 (95% CI: 0.417-0.714). The radiomics-only model increased the AUC numerically to 0.660 (95% CI: 0.532-0.773), whereas the addition of BMI did not improve discrimination (AUC: 0.647; 95% CI: 0.518-0.763). The age+BMI+radiomics model yielded an AUC of 0.666 (95% CI: 0.541-0.784), and the full clinical+radiomics model yielded an AUC of 0.668 (95% CI: 0.543-0.784), with a sensitivity of 28.6% and a specificity of 86.4%.
Table 3. Performance of the primary three-class Naive Bayes models
Model | Osteoporosis AUC (95% CI) | Sensitivity, % (95% CI) | Specificity, % (95% CI) | Overall accuracy, % | Balanced accuracy, % | Macro-F1 | Weighted kappa |
|---|---|---|---|---|---|---|---|
Clinical-only | 0.570 (0.417-0.714) | 28.6 (10.5-48.1) | 87.5 (80.0-94.0) | 60.6 | 45.9 | 0.471 | 0.217 |
Radiomics-only | 0.660 (0.532-0.773) | 19.0 (4.3-38.1) | 80.7 (72.1-88.5) | 43.1 | 34.1 | 0.340 | 0.026 |
BMI + radiomics | 0.647 (0.518-0.763) | 14.3 (0-30.8) | 83.0 (74.7-90.2) | 43.1 | 33.0 | 0.328 | 0.002 |
Age + BMI + radiomics | 0.666 (0.541-0.784) | 19.0 (4.3-38.1) | 83.0 (74.7-90.3) | 45.0 | 36.1 | 0.358 | 0.047 |
Full clinical + radiomics | 0.668 (0.543-0.784) | 28.6 (10.0-50.0) | 86.4 (78.7-93.1) | 49.5 | 41.8 | 0.417 | 0.145 |
Majority-class baseline | — | 0 | 100 | 60.6 | 33.3 | 0.251 | 0 |
In a one-versus-rest framework, sensitivity and specificity are defined with respect to osteoporosis. Weighted kappa denotes the linearly weighted Cohen’s kappa. The majority-class classifier assigned all participants to osteopenia and was included as a non-probabilistic reference benchmark
CI: Confidence interval, BMI: Body mass index, AUC: Area under the curve
Overall, three-class performance remained limited. The full clinical+radiomics model achieved an overall accuracy of 49.5%, balanced accuracy of 41.8%, macro-F1 score of 0.417, and linearly weighted Cohen’s kappa of 0.145. By comparison, the majority-class reference classifier, which assigned every participant to the osteopenia group, achieved a higher overall accuracy of 60.6% but a lower balanced accuracy of 33.3%, a macro-F1 score of 0.251, and a weighted kappa of 0. These results indicate that the model provided some class-balanced information beyond the majority-class rule but did not improve the accuracy of exact three-category classification.
Class-wise Performance
Class-wise evaluation of the full clinical + radiomics model further demonstrated the limitations of exact three-category classification ( and and ). Discrimination was highest for osteoporosis (AUC: 0.668; 95% CI: 0.543-0.784), whereas discrimination for normal BMD and osteopenia was close to chance level (AUCs: 0.549 and 0.500, respectively). The model correctly classified 8 of 22 participants as normal, 40 of 66 as having osteopenia, and 6 of 21 as having osteoporosis.
Table 4. Class-wise performance of the full clinical+radiomics model in the primary three-class analysis
Class | AUC | OvR accuracy | Sensitivity | Specificity | Precision | F1 | MCC |
Normal | 0.549 | 69.7% | 36.4% | 78.2% | 29.6% | 0.327 | 0.135 |
Osteopenia | 0.500 | 54.1% | 60.6% | 44.2% | 62.5% | 0.615 | 0.048 |
Osteoporosis | 0.668 | 75.2% | 28.6% | 86.4% | 33.3% | 0.308 | 0.159 |
OvR: One-versus-rest, AUC: Area under the receiver operating characteristic curve, MCC: Matthews correlation coefficient
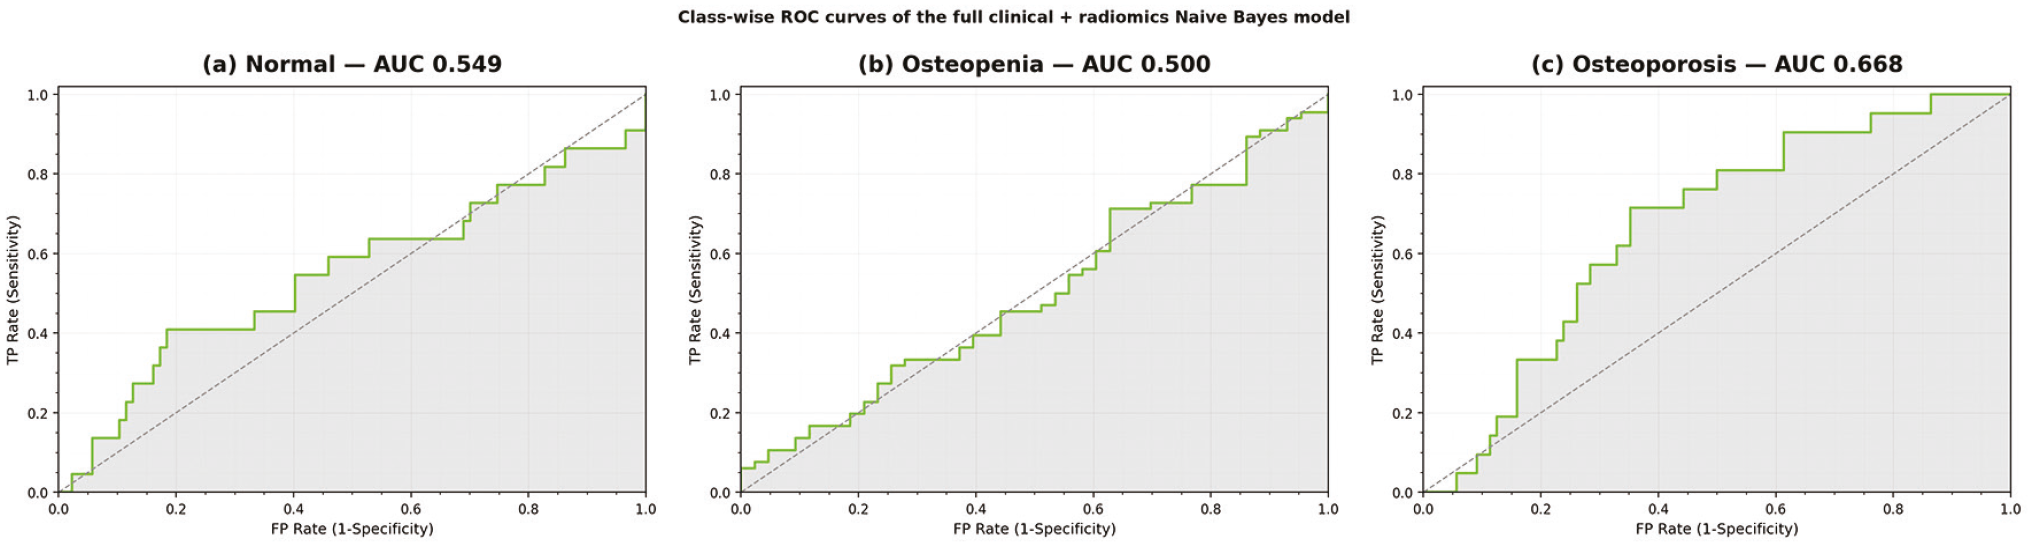
AUC: Area under the curve, BMD: Bone mineral density, ROC: Receiver operating characteristic
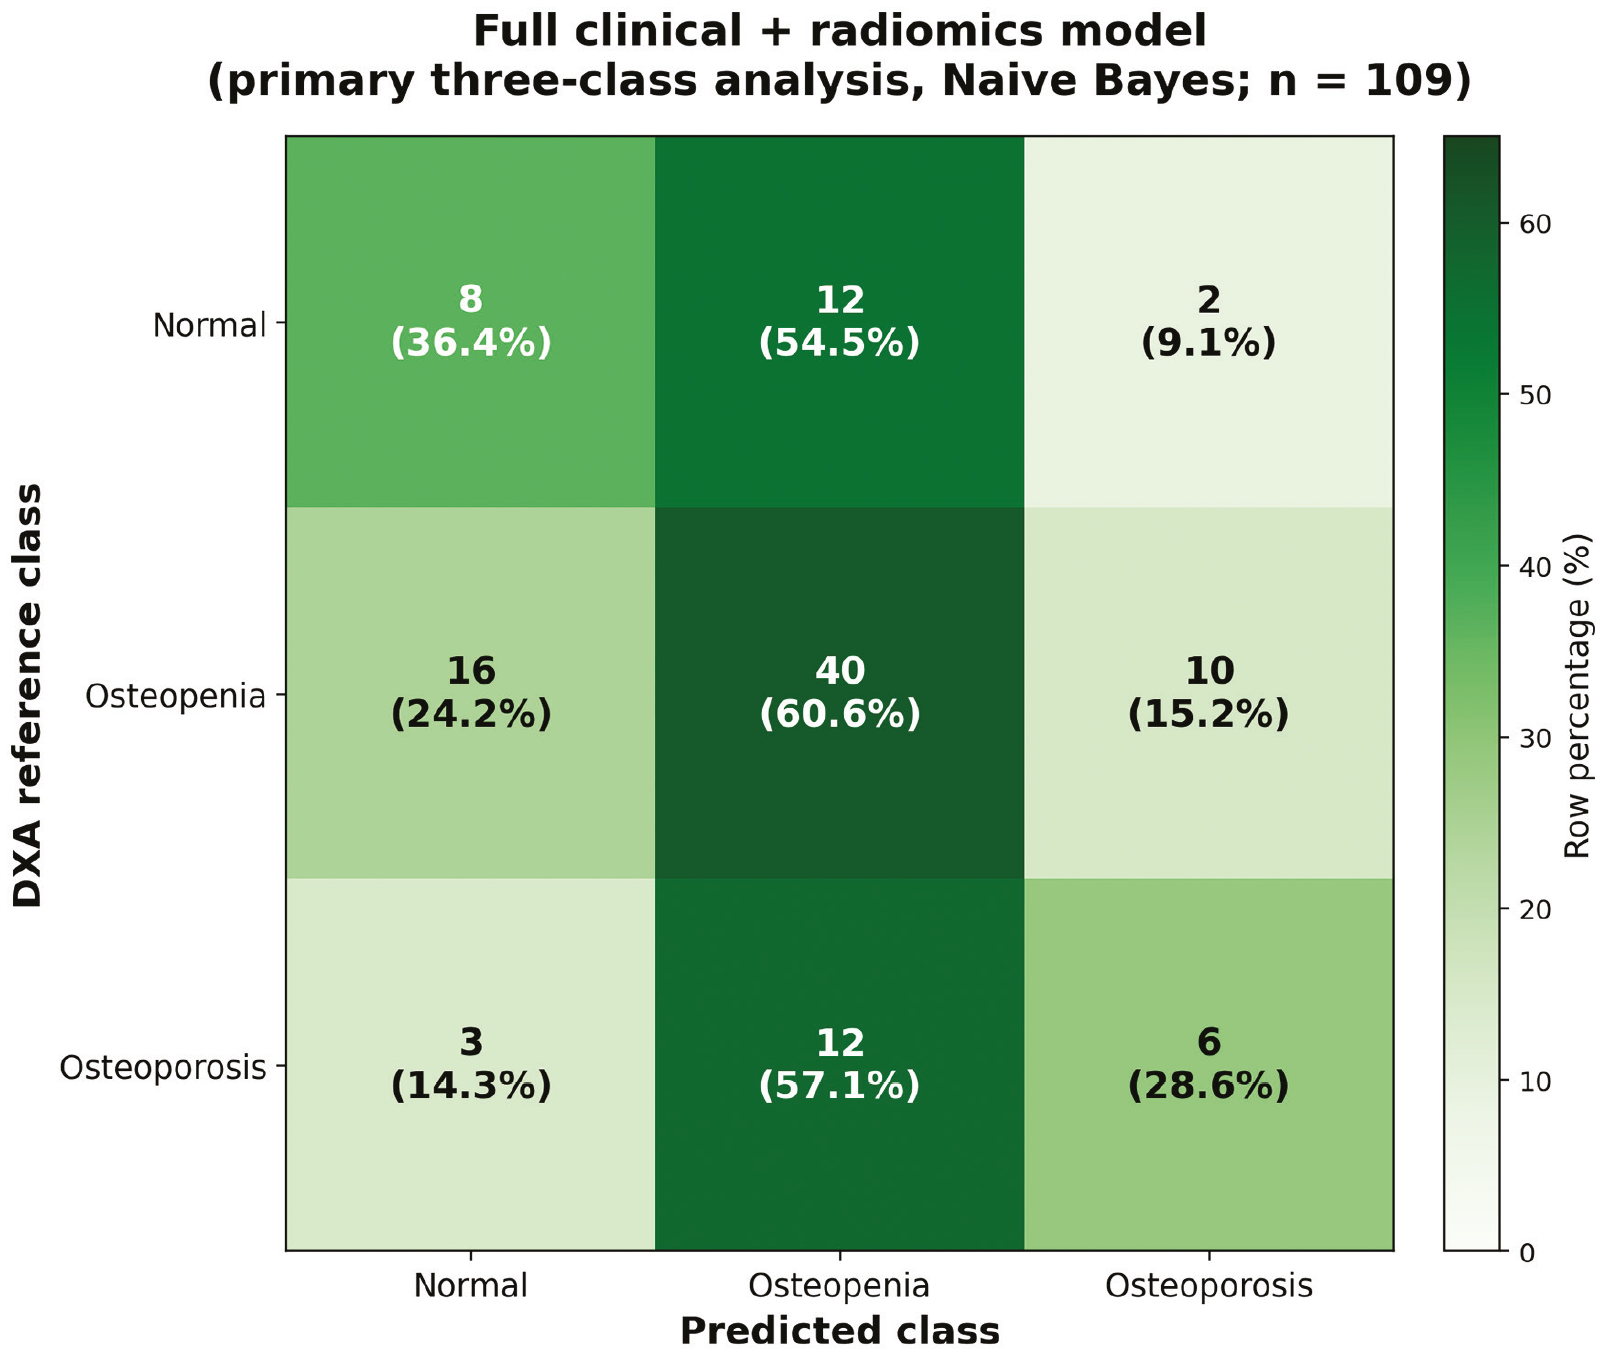
BMD: Bone mineral density, DXA: Dual-energy X-ray absorptiometry
Secondary Binary Analysis
When normal BMD and osteopenia were combined into a non-osteoporosis category, the clinical-only model showed limited discrimination, with an AUC of 0.565 (95% CI: 0.414-0.708). The radiomics-only model achieved an AUC of 0.653 (95% CI: 0.526-0.774), and the full clinical+radiomics model yielded an identical AUC of 0.653 (95% CI: 0.525-0.773) ( and ). Using the model-derived classification rule, the radiomics-only model identified 5 of 21 osteoporosis cases, corresponding to a sensitivity of 23.8% and a specificity of 78.4%. The full clinical+radiomics model identified 6 of 21 cases of osteoporosis, with a sensitivity of 28.6% and a specificity of 76.1%. The paired patient-level bootstrap comparison showed no evidence of incremental discrimination after adding the clinical variables to radiomics (Delta AUC: 0.000; 95% CI: -0.050 to 0.048).
Table 5. Performance of the secondary osteoporosis-versus-non-osteoporosis Naive Bayes models
Model | AUC (95% CI) | Accuracy | Sensitivity (95% CI) | Specificity (95% CI) | Precision | F1 | MCC |
Clinical-only | 0.565 (0.414-0.708) | 74.3% | 9.5% (0-25.0) | 89.8% (83.0-95.5) | 18.2% | 0.125 | -0.009 |
Radiomics-only | 0.653 (0.526-0.774) | 67.9% | 23.8% (5.9-43.5) | 78.4% (69.7-86.8) | 20.8% | 0.222 | 0.021 |
Full clinical + radiomics | 0.653 (0.525-0.773) | 67.0% | 28.6% (9.5-50.0) | 76.1% (66.7-84.9) | 22.2% | 0.250 | 0.043 |
For the paired comparison of full clinical+radiomics versus radiomics alone, Delta AUC = 0.000 (95% CI, -0.050 to 0.048)
AUC: Area under the receiver operating characteristic curve, MCC: Matthews correlation coefficient, CI: Confidence interval
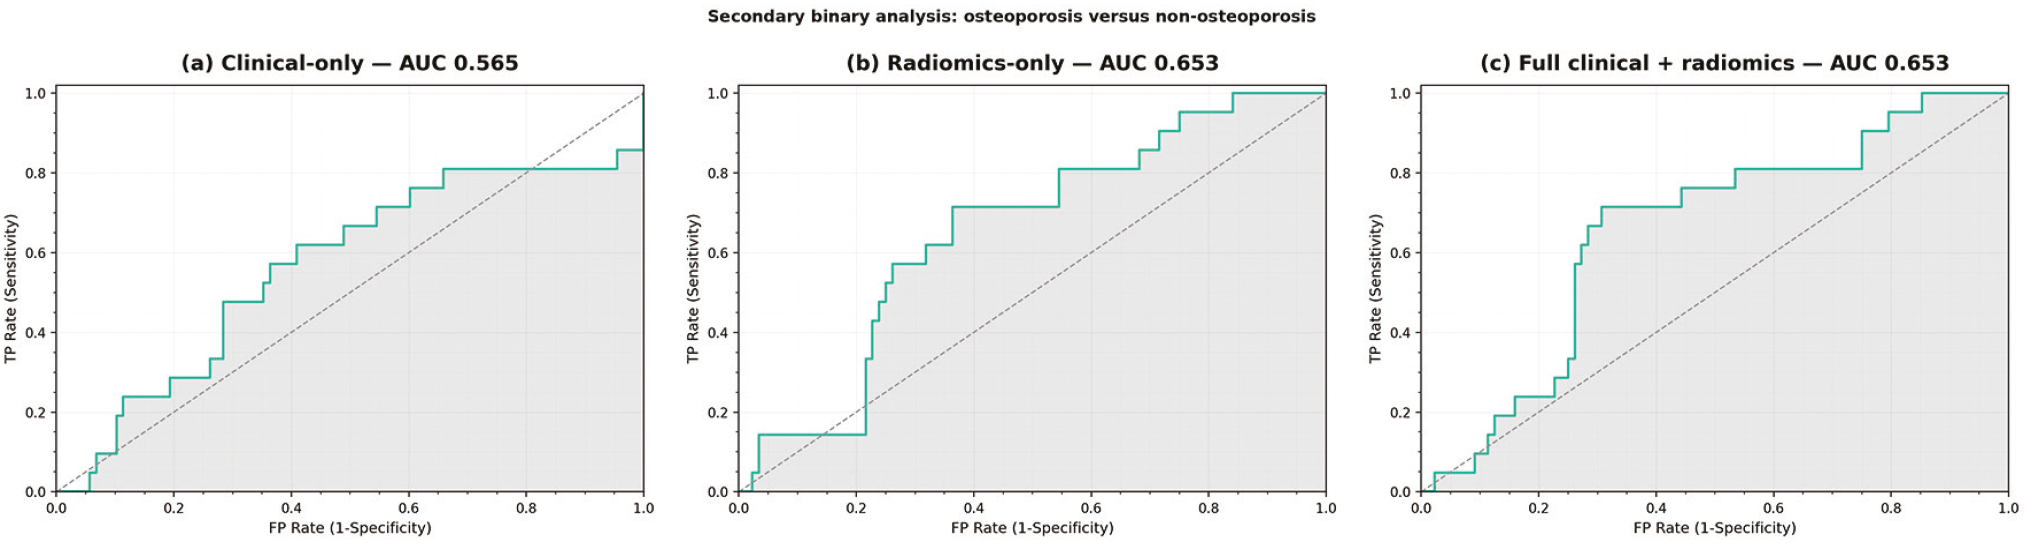
AUC: Area under the curve, CI: Confidence interval
Sensitivity Analysis Related to Menopausal Status
Because a value of 0 for estrogen-free years could represent either premenopausal status or less than 1 year since menopause, a conservative sensitivity analysis excluded all five participants with that value. The resulting cohort comprised 104 women (normal BMD, n=20; osteopenia, n=63; osteoporosis, n=21). The binary findings were materially unchanged. The radiomics-only model yielded an AUC of 0.665 (95% CI: 0.543-0.785), whereas the full clinical+radiomics model yielded an AUC of 0.661 (95% CI: 0.533-0.785). The paired difference remained negligible (Delta AUC: -0.004; 95% CI: -0.044 to 0.034). Thus, the principal binary findings were not driven by participants with zero-coded estrogen-free years.
Discussion
This exploratory proof-of-concept study evaluated whether quantitative radiomic features extracted from a standardized patellar region on routine lateral knee radiographs contain information related to DXA-defined BMD status. After repeating the analysis using a leakage-free repeated internal validation framework with fold-specific feature selection, three main findings emerged. First, patellar radiomics showed modest discrimination of osteoporosis, with an AUC of 0.660 in the primary three-class setting and 0.653 in the secondary osteoporosis-versus-non-osteoporosis analysis. Second, the addition of age, BMI, and estrogen-free years did not improve discrimination beyond radiomics for the binary task. Third, exact three-category classification remained limited. Although the combined model performed better than the majority-class reference on class-balanced measures, its overall accuracy remained below the 60.6% obtained by assigning all participants to the osteopenia category. These findings support a measurable, albeit limited, radiographic texture signal and emphasize the need for cautious interpretation in a small, internally validated cohort.
The primary three-class task was particularly challenging. The full clinical+radiomics model yielded an osteoporosis-class AUC of 0.668; however, its overall accuracy was 49.5%, compared with 60.6% for the majority-class baseline. The apparently discordant results across metrics are informative. Overall accuracy was strongly influenced by the predominance of osteopenia, whereas balanced accuracy, macro-F1, and weighted Cohen’s kappa placed greater weight on performance across all three categories. The combined model improved balanced accuracy from 33.3% for the majority-class reference to 41.8% and macro-F1 from 0.251 to 0.417, suggesting that it captured some information beyond class prevalence. Nevertheless, these values remain insufficient for reliable individual-level classification. Osteopenia is an intrinsically broad, intermediate BMD category, and its overlap with adjacent normal and osteoporotic groups may make precise separation into three classes more difficult. Measurement variability in the reference standard, class imbalance, and limited sample size may have contributed.
The secondary binary analysis provided a more direct assessment of osteoporosis discrimination. Radiomics alone yielded an AUC of 0.653, compared with 0.565 for clinical variables alone. Bone architecture adapts to mechanical loading (), and age, BMI, and age at menopause are associated with osteoporotic fracture risk (). Adding age, BMI, and estrogen-free years did not increase the AUC (0.653), and the paired bootstrap estimate of the difference was essentially null (Delta AUC: 0.000; 95% CI: -0.050 to 0.048). Although sensitivity increased from 23.8% to 28.6% after the addition of the clinical variables, the increase occurred without improvement in overall discrimination and was accompanied by a reduction in specificity from 78.4% to 76.1%. Accordingly, the present data do not support a reproducible incremental contribution of the evaluated clinical variables beyond the radiomic features. In particular, the low sensitivity observed in the model-derived classification rule limits the suitability of the present models for osteoporosis screening or DXA referral in clinical practice.
An additional finding was the instability of individual radiomic features. Despite restricting the principal analysis to a maximum of 10 features, 220 distinct features were selected at least once across the 200 training folds in the three-class analysis, and 191 were selected at least once in the binary analysis; no single feature was retained in every training fold. The most frequently selected features were retained in 64.5% of three-class folds and 90.0% of binary folds. This variability is consistent with the high dimensionality of the original 930-feature space relative to the number of participants and osteoporosis cases, and indicates that the current data do not support a fixed patellar radiomic signature. Importantly, increasing the maximum number of selected features did not consistently improve performance. In the binary task, radiomics-only AUCs were 0.598, 0.653, 0.657, and 0.616 when the feature cap was set at 5, 10, 20, and 30, respectively. Thus, the results favor a parsimonious modeling strategy while also illustrating substantial uncertainty in feature-level interpretation.
The present findings should be interpreted within the broader literature on opportunistic osteoporosis assessment. Quantitative CT, CT radiomics, and deep-learning approaches applied to routine imaging have demonstrated the potential to derive bone-health information from examinations obtained for other indications (12-16,24). Radiograph-based investigations of the patella, knee, foot, and ankle have similarly suggested that conventional radiographs contain information associated with BMD status (-). Clinical covariates have also been incorporated into lumbar radiograph-based models (). A systematic review of deep-learning models using plain radiographs reported promising diagnostic performance but also emphasized the limited number of available studies and the need for further clinical validation (). More recently, multi-site validation of hip and pelvic radiographs has highlighted the importance of testing radiographic osteoporosis models across scanners, patient subgroups, and clinical environments (). Direct numerical comparison with the present results is difficult because these studies differ substantially in anatomical site, outcome definition, model architecture, cohort size, and validation strategy.
The standardized 15-mm patellar ROI remains a practical feature of the present approach. It provides a simple and anatomically predefined sampling strategy and avoids the segmentation complexity of whole-bone or end-to-end models. Nevertheless, gray levels on plain radiographs are not calibrated measurements of physical density. Detector characteristics, exposure parameters, image processing, pixel spacing, and positioning can influence the apparent texture from which radiomic features are derived. Image normalization and gray-level discretization may reduce some sources of intensity variation, but cannot fully eliminate acquisition dependence. The absence of spatial resampling in the present analysis may have introduced additional variability in texture measurements. These considerations are especially important, given the observed feature-selection instability, and underscore the need for multi-vendor and external validation before biological meaning is assigned to individual features or clinical use is considered.
Menopausal status coding also required careful interpretation. Estrogen-free years were unavailable for 11 participants, and a value of 0 represented either premenopausal status or a period of less than 1 year since menopause. Because these states could not be reliably distinguished retrospectively, we performed a conservative sensitivity analysis, excluding all five participants with a value of 0. Binary discrimination was materially unchanged: the radiomics-only and full models yielded AUCs of 0.665 and 0.661, respectively, with no evidence of incremental benefit from the clinical variables (Delta AUC: -0.004; 95% CI: -0.044 to 0.034). Thus, the principal binary findings were not driven by participants with potentially premenopausal or very early postmenopausal status. Nevertheless, prospective studies should record menopausal status explicitly and use age-appropriate DXA interpretation.
Study Limitations
This study has several limitations. First, it was retrospective and single-center, with only 109 participants and 21 osteoporosis cases, resulting in substantial uncertainty in model performance estimates despite repeated stratified cross-validation. Second, 930 radiomic features were initially available, creating a high-dimensional setting relative to the sample size. Although feature selection was confined to each training fold and the principal model was deliberately restricted to a maximum of 10 radiomic features, feature selection stability remained limited. Third, all performance estimates were derived from internal validation; an independent external test cohort was not available. The results should therefore be considered exploratory rather than evidence of clinical generalizability.
Fourth, the three-class models showed limited performance and did not exceed the majority-class benchmark in overall accuracy. The low sensitivity of the binary models under the model-derived classification rule also precludes use as a clinical screening or DXA-referral system in their present form. Fifth, a single experienced radiologist performed ROI placement; intra- and interobserver reproducibility were not assessed. Although the fixed-size, anatomically predefined ROI was intended to simplify placement, its reproducibility requires direct evaluation. Sixth, radiographs were obtained during routine clinical practice; no spatial resampling was performed; variation in detector characteristics, exposure, positioning, post-processing, and pixel spacing may have influenced texture features. Detailed per-examination acquisition parameters were not consistently retained in the analytic dataset.
Seventh, data on estrogen-free years were unavailable for 11 participants, and zero-coded values could not distinguish premenopausal women from those within their first postmenopausal year. The conservative exclusion sensitivity analysis reduced concern that these participants drove the main binary results but did not replace prospectively recorded menopausal status. Eighth, the reference classification was based on the lowest T-score documented in the finalized clinical DXA report. Raw DXA scans, scanner-specific quality-control records, and site-level adjudication of degenerative or invalid lumbar measurements were not available in the analytic dataset for retrospective re-review; this also limits interpretation for potentially premenopausal participants, for whom Z-scores are generally preferred. The present study evaluated a predefined Naive Bayes-based proof-of-concept framework rather than conducting an extensive comparison of machine-learning algorithms. Future work should prioritize larger multicenter cohorts, standardized acquisition and preprocessing, reproducibility assessment, independent external validation, and prospective evaluation before consideration of clinical implementation.
Conclusion
Patellar radiomic features extracted from routine lateral knee radiographs showed modest discrimination for DXA-defined osteoporosis under leakage-free, repeated internal validation. Clinical variables did not demonstrate an incremental AUC benefit beyond radiomics in the binary analysis, and the exact three-class BMD classification remained limited. The substantial variability of selected radiomic features and uncertainty in performance estimates indicate that the present findings should be regarded as exploratory evidence for a radiographic texture signal rather than a clinically applicable screening model. Larger externally validated studies are required to determine whether this signal can be developed into a robust opportunistic approach for osteoporosis assessment.
Footnotes
Ethics
Ethics Committee Approval: The study was approved by the Ege University Medical Research Ethics Committee (approval number: 26-6.1T/13, date: 18.06.2026).
Informed Consent: Because of the retrospective and fully anonymized study design, the requirement for written informed consent was waived.
Acknowledgments
During the preparation of this manuscript, the authors used Claude (Anthropic, San Francisco, CA, USA) and ChatGPT (OpenAI, San Francisco, CA, USA) to assist with language editing, reference-format checks, methodological wording, and the preparation or refinement of summary figures based on the authors’ own analysis outputs. The tools were not used for patient selection, image segmentation, radiomic feature extraction, statistical analysis, or generation of primary study data. All AI-assisted content was verified against the source data, analysis outputs, software settings, and original publications and reviewed and edited by the authors. The authors take full responsibility for the content of the manuscript.
Authorship Contributions
Concept: F.E., Design: F.E., Data Collection or Processing: F.E., F.T., Analysis or Interpretation: F.E., F.T., Literature Search: F.E., F.T., Writing: F.E., F.T.
Conflict of Interest: No conflict of interest was declared by the authors.
Financial Disclosure: The authors declared that this study received no financial support.
References
Xiao PL, Cui AY, Hsu CJ, Peng R, Jiang N, Xu XH, et al. Global, regional prevalence, and risk factors of osteoporosis according to the World Health Organization diagnostic criteria: a systematic review and meta-analysis. Osteoporos Int. 2022;33:2137-53.
Perez MO, Pedro PPA, Lyrio AM, Grizzo FMF, Loures MAADR. Osteoporosis and fracture risk assessment: improving outcomes in postmenopausal women. Rev Assoc Med Bras (1992). 2023;69:e2023S130.
Cheng CH, Chen LR, Chen KH. Osteoporosis due to hormone imbalance: an overview of the effects of estrogen deficiency and glucocorticoid overuse on bone turnover. Int J Mol Sci. 2022;23:1376.
Khosla S, Riggs BL. Pathophysiology of age-related bone loss and osteoporosis. Endocrinol Metab Clin North Am. 2005;34:1015-30, xi.
Kanis JA. Assessment of fracture risk and its application to screening for postmenopausal osteoporosis: synopsis of a WHO report. WHO Study Group. Osteoporos Int. 1994;4:368-81.
US Preventive Services Task Force; Nicholson WK, Silverstein M, Wong JB, Chelmow D, Coker TR, et al. Screening for osteoporosis to prevent fractures: US preventive services task force recommendation statement. JAMA. 2025;333:498-508.
Kanis JA, Johnell O, Oden A, Johansson H, McCloskey E. FRAX and the assessment of fracture probability in men and women from the UK. Osteoporos Int. 2008;19:385-97.
Pickhardt PJ, Correale L, Hassan C. AI-based opportunistic CT screening of incidental cardiovascular disease, osteoporosis, and sarcopenia: cost-effectiveness analysis. Abdom Radiol (NY). 2023;48:1181-98.
van Griethuysen JJM, Fedorov A, Parmar C, Hosny A, Aucoin N, Narayan V, et al. Computational radiomics system to decode the radiographic phenotype. Cancer Res. 2017;77:e104-7.
Zwanenburg A, Vallières M, Abdalah MA, Aerts HJWL, Andrearczyk V, Apte A, et al. The image biomarker standardization initiative: standardized quantitative radiomics for high-throughput image-based phenotyping. Radiology. 2020;295:328-38.
Shevroja E, Reginster JY, Lamy O, Al-Daghri N, Chandran M, Demoux-Baiada AL, et al. Update on the clinical use of trabecular bone score (TBS) in the management of osteoporosis: results of an expert group meeting organized by the European Society for Clinical and Economic Aspects of Osteoporosis, Osteoarthritis and Musculoskeletal Diseases (ESCEO), and the International Osteoporosis Foundation (IOF) under the auspices of WHO collaborating center for epidemiology of musculoskeletal health and aging. Osteoporos Int. 2023;34:1501-29.
Oh S, Kang WY, Park H, Yang Z, Lee J, Kim C, et al. Evaluation of deep learning-based quantitative computed tomography for opportunistic osteoporosis screening. Sci Rep. 2024;14:363.
Du C, He J, Cheng Q, Hu M, Zhang J, Shen J, et al. Automated opportunistic screening for osteoporosis using deep learning-based automatic segmentation and radiomics on proximal femur images from low-dose abdominal CT. BMC Musculoskelet Disord. 2025;26:378.
Erdem F, Akay E, Demirpolat G, Yanık Keyik B, Bülbül E. The use of radiomics data obtained from ADC map of lumbar MRI and machine learning in diagnosis of osteoporosis. Iran J Radiol. 2024;21:e147913.
Güngör C, Akay E, Erdem F, Bülbül E, Demirpolat G, Yanık B. Opportunistic prediction of osteoporosis with machine learning models based on clivus-radiomic features obtained from CT images. Turk J Osteoporos. 2025;31:52-60.
Erdem F, Yanık B, Yasin-Arslan T, Akay E, Bülbül E, Demirpolat G. Volumetric computed tomography Hounsfield unit analysis: a superior method for opportunistic osteoporosis screening and assessment. Cir Cir. 2026;94:353-61.
Mulyono A, Islam MM, Panse VR. Patella radiograph image texture: the correlation with lumbar spine bone mineral density values. Jurnal Ilmiah Pendidikan Fisika Al-Biruni. 2022;11:69-75.
Meertens R, Lopez B, Gundry M, Crone B, Vigers W, Evans M, et al. Diagnostic utility of IBEX Bone Health for assessment of osteoporosis from knee radiographs. Front Mol Biosci. 2025;12:1671053.
Gharehmohammadi F, Sebro R. Deep learning opportunistic screening for osteoporosis and osteopenia using radiographs of the foot or ankle - a pilot study. Eur J Radiol. 2025;184:111980.
Fedorov A, Beichel R, Kalpathy-Cramer J, Finet J, Fillion-Robin JC, Pujol S, et al. 3D Slicer as an image computing platform for the Quantitative Imaging Network. Magn Reson Imaging. 2012;30:1323-41.
Yu L, Liu H. Feature selection for high-dimensional data: a fast correlation-based filter solution. In: Fawcett T, Mishra N, editors. Proceedings of the 20th International Conference on Machine Learning; 2003 Aug 21-24; Washington, DC. Menlo Park: AAAI Press; 2003. p. 856-63.
Frost HM. Wolff’s law and bone’s structural adaptations to mechanical usage: an overview for clinicians. Angle Orthod. 1994;64:175-88.
Long G, Liu C, Liang T, Zhang Z, Qin Z, Zhan X. Predictors of osteoporotic fracture in postmenopausal women: a meta-analysis. J Orthop Surg Res. 2023;18:574.
Westerhoff M, Gyftopoulos S, Dane B, Vega E, Murdock D, Lindow N, et al. Deep learning-based opportunistic CT osteoporosis screening and the establishment of normative values. Radiology. 2025;317:e250917.
Mao L, Xia Z, Pan L, Chen J, Liu X, Li Z, et al. Deep learning for screening primary osteopenia and osteoporosis using spine radiographs and patient clinical covariates in a Chinese population. Front Endocrinol (Lausanne). 2022;13:971877.
Yen TY, Ho CS, Chen YP, Pei YC. Diagnostic accuracy of deep learning for the prediction of osteoporosis using plain X-rays: a systematic review and meta-analysis. Diagnostics (Basel). 2024;14:207.
Pignolo RJ, Connell JJ, Briggs W, Kelly CJ, Tromans C, Sultana N, et al. Opportunistic assessment of osteoporosis using hip and pelvic X-rays with OsteoSight™: validation of an AI-based tool in a US population. Osteoporos Int. 2025;36:1053-60.